The R language provides many different tools for creating maps and adding data to them. I’ve been using the leaflet package at work recently, so I thought I’d provide a short example here.
Whilst searching for some data that might make a nice map, I came across this article at ABC News. It includes a table containing Australian members of parliament, their electorate and their voting intention regarding legalisation of same-sex marriage. Since I reside in New South Wales, let’s map the data for electorates in that state.
Here’s the code at Github. The procedure is pretty straightforward:
- Obtain a shapefile of New South Wales electorates (from here) and read into R
- Read the data from the ABC News web page into a data frame (very easy using
rvest) - Match the electorate names from the two sources (they match perfectly, well done ABC!)
- Use the match to add a voting intention variable to the shapefile data
- Use leaflet to generate the map of New South Wales with electorates coloured by voting intention
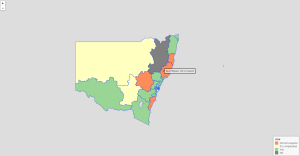 At right, a non-interactive screen grab of the result (click for larger version). For the full interactive map visit this page where you can zoom, drag and mouse-over to see how Leaflet maps work.
I like R/leaflet a lot. It generates high-quality interactive maps and it’s easy to experiment in and publish from Rstudio. Some of the syntax feels a little clunky (a mix of newer “pipes” and older “formula-style”) and generating colour palettes feels strange if you spend most time in ggplot2. However, some of that is probably my inexperience with the package as much as anything else.
