Sometime in 2009, I began listening to a science podcast titled This Week in Virology, or TWiV for short. I thought it was pretty good and listened regularly up until sometime in 2016, when it seemed that most episodes were approaching two hours in duration. I listen to several podcasts when commuting to/from work, which takes up about 10 hours of my week, so I found it hard to justify two hours for one podcast, no matter how good.
Were the episodes really getting longer over time? Let’s find out using R.
One thing I’ve learned as a data scientist: management want to see the key points first. So here it is:

Technical people want to see how we got there.
It turns out that the podcast has an RSS feed (in XML format), containing detailed information about every episode to date. Once there was the XML package, which was OK, but now we have rvest and xml2, which makes life much easier.
Full code and a markdown report can be found at Github, so don’t copy and paste from here. Here are the highlights. First, as data for each episode is found between item tags, it can be extracted from the feed like so:
library(rvest)
feed_items <- read_xml("http://twiv.microbeworld.libsynpro.com/twiv") %>%
  xml_nodes("item")
Podcast date is stored in pubDate and duration in itunes:duration, so we can extract the text between those tags:
feed_items %>%
  xml_nodes("pubDate") %>%
  xml_text()

feed_items %>%
  xml_nodes("itunes\\:duration") %>%
  xml_text()
Durations less than 1 hour are represented as minutes:seconds, e.g. “55:42”, as opposed to “02:01:33”. So we can count the colons, prepend “00:” (zero hours) if there is only one, convert to hours, minutes and seconds using lubridate and then convert to numeric seconds. We can also convert the date/time string to class datetime.
# assume myDF is a data frame with columns named pubDate, duration
myDF %>%
  mutate(pubDate = as.POSIXct(strptime(pubDate, "%a, %d %b %Y %H:%M:%S +0000")),
         duration = ifelse(grepl(":\\d+:", duration), duration, paste0("00:", duration)),
         duration_seconds = as.numeric(hms(duration)))
We have dates, we have durations (bar one for episode 124 – not a big deal), we’re good to go.
I tried a scatter plot. I tried summarising mean duration by year. However, in the end I finally found a use for…the “joy plot” – or as it seems to have been renamed, the ridgeline plot. I still have mixed feelings about it: isn’t it just a density plot with facets? Should it obscure data by default? On the whole though, I think it has some merit for examining distributions over time.
And so back to the chart at the start, showing TWiV episode duration over time. We can see that the average episode in 2017 is around twice the duration of those in 2008 (close to 100 minutes versus 50). The duration distribution has shifted to the right over time but has come back to the left a little in 2017, from a maximum peak in 2016. So perhaps I’ll be able to listen again soon.
If only TWiV were more like TWiM – This Week in Microbiology.
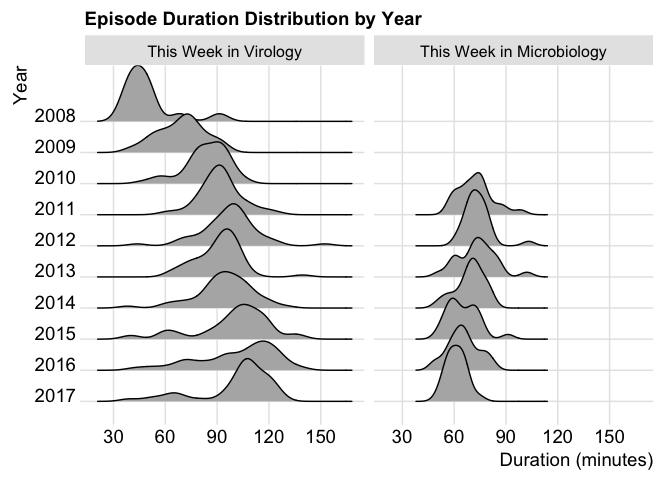
TWiM rarely strays beyond 90 minutes and this year, forms a nice round peak right about the one hour mark. In my opinion, a sensible maximum for a podcast.

Cool! Are you telling me I should replace the XML package with rvest or xml2 even it is working fine in my scripts now?
I still use the XML package in old code too and would not change just for the sake of it. I like rvest a lot for parsing or scraping web data though, and it’s designed to work naturally with xml2, so I think the combo is worth investigating.