Some basics of biomaRt

One of the commonest bioinformatics questions, at Biostars and elsewhere, takes the form: “I have a list of identifiers (X); I want to relate them to a second set of identifiers (Y)”. HGNC gene symbols to Ensembl Gene IDs, for example.

When this occurs I have been known to tweet “the answer is BioMart” (there are often other solutions too) and I’ve written a couple of blog posts about the R package biomaRt in the past. However, I’ve realised that we need to take a step back and ask some basic questions that new users might have. How do I find what marts and datasets are available? How do I know what attributes and filters to use? How do I specify different genome build versions?
Continue reading

Make prettier documents by reusing chunks in RMarkdown

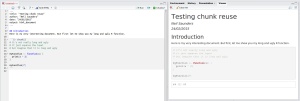
No revelations here, just a little R tip for generating more readable documents.

Screenshot-RStudio.png

Original with lots of code at the top

There are times when I want to show code in a document, but I don’t want it to be the first thing that people see. What I want to see first is the output from that code. In this silly example, I want the reader to focus their attention on the result of myFunction(), which is 49.
Continue reading

Web scraping using Mechanize: PMID to PMCID/NIHMSID

Web services are great. Pass them a URL. Structured data comes back. Parse it, analyse it, visualise it. Done.

Web scraping – interacting programmatically with a web page – is not so great. It requires more code and when the web page changes, the code breaks. However, in the absence of a web service, scraping is better than nothing. It can even be rather satisfying. Early in my bioinformatics career the realisation that code, rather than humans, can automate the process of submitting forms and reading the results was quite a revelation.

In this post: how to interact with a web page at the NCBI using the Mechanize library.

Read the rest…

How to: remember that you once knew how to parse KEGG

Recently, someone asked me if I could generate a list of genes associated with a particular pathway. Sure, I said and hacked together some rather nasty code in R which, given a KEGG pathway identifier, used a combination of the KEGG REST API, DBGET and biomaRt to return HGNC symbols.

Coincidentally, someone asked the same question at Biostar. Pierre recommended the TogoWS REST service, which provides an API to multiple biological data sources. An article describing TogoWS was published in 2010.

An excellent suggestion – and one which, I later discovered, I had bookmarked. Twice. As long ago as 2008. This “rediscovery of things I once knew” happens to me with increasing frequency now, which makes me wonder whether (1) we really are drowning in information, (2) my online curation tools/methods require improvement or (3) my mind is not what it was. Perhaps some combination of all three.

Anyway – using Ruby (1.8.7), a list of HGNC symbols given a KEGG pathway, e.g. MAPK signaling, is as simple as:

require 'rubygems'
require 'open-uri'
require 'json/pure'

j = JSON.parse(open("http://togows.dbcls.jp/entry/pathway/hsa04010/genes.json").read)
g = j.first.values.map {|v| /^(.*?);/.match(v)[1] }
# first 5 genes
g[0..4]
# ["MAP3K14", "FGF17", "FGF6", "DUSP9", "MAP3K6"]

This code parses the JSON returned from TogoWS into an array with one element; the element is a hash with key/value pairs of the form:

"9020"=>"MAP3K14; mitogen-activated protein kinase kinase kinase 14 [KO:K04466] [EC:2.7.11.25]"

Values for all keys that I’ve seen to date begin with the HGNC symbol followed by a semicolon, making extraction quite straightforward with a simple regular expression.

Custom CSS for HTML generated using RStudio

Update August 5 2014: I noticed this post is getting some hits; please note that it is an old post, it’s probably outdated and there’s likely to be a better solution by now

People have been telling me for a while that the latest version of RStudio, the IDE for R, is a great way to generate reports. I finally got around to trying it out and for once, the hype is justified. Start with this excellent tutorial from Jeremy Anglim.

Briefly: the process is not so different to Sweave, except that (1) instead of embedding R code in LaTeX, we embed R code in a document written using R Markdown; (2) instead of Sweave, we use the knitr package; (3) the focus is on generating HTML documents for publishing to the Web (see e.g. RPubs), although knitr can also generate PDF documents, just like Sweave.

It took me a little while to figure out a couple of things. First, how best to generate HTML tables, ideally using the xtable package. Second, how to override the default RStudio/R Markdown style. I’ve documented those tasks in this post.
Read the rest…

Redmine + Gitolite integration

I’m a big fan of both Redmine, the project management web application and Git, the distributed version control system.

Recently, I learned that it’s possible to integrate Git into Redmine so that git repositories for a project can be created via the Redmine web interface. This is done using plugins which connect Redmine with git hosting software: either gitosis or more recently, gitolite.

Unfortunately, this is a deeply-confusing process for novices like myself. There are multiple forks of the plugins, long threads in the Redmine forums that discuss various hacks/tweaks to make things work and no one authoritative source of documentation. After much experimentation, this is what worked for me. I can’t guarantee success for you.

Read the rest…

Sequencing for relics from the Sanger era part 1: getting the raw data

Sequencing in the good old days

In another life, way back in the mists of time, I did a Ph.D. Part of my project was to sequence a bacterial gene which encoded an enzyme involved in nitrite metabolism. It took the best part of a year to obtain ~ 2 000 bp of DNA sequence: partly because I was rubbish at sequencing, but also because of the technology at the time. It was an elegant biochemical technique called the dideoxy chain termination method, or “Sanger sequencing” after its inventor. Sequence was visualized by exposing radioactively-labelled DNA to X-ray film, resulting in images like the one at left, from my thesis. Yes, that photograph is glued in place. The sequence was read manually, by placing the developed film on a light box, moving a ruler and writing down the bases.

By the time I started my first postdoc, technology had moved on a little. We still did Sanger sequencing but the radioactive label had been replaced with coloured dyes and a laser scanner, which allowed automated reading of the sequence. During my second postdoc, this same technology was being applied to the shotgun sequencing of complete bacterial genomes. Assembling the sequence reads into contigs was pretty straightforward: there were a few software packages around, but most people used a pipeline of Phred (to call base qualities), Phrap (to assemble the reads) and Consed (for manual editing and gap-filling strategy).

The last time I worked directly on a project with sequencing data was around 2005. Jump forward 5 years to the BioStar bioinformatics Q&A forum and you’ll find many questions related to sequencing. But not sequencing as I knew it. No, this is so-called next-generation sequencing, or NGS. Suddenly, I realised that I am no longer a sequencing expert. In fact:

I am a relic from the Sanger era

I resolved to improve this state of affairs. There is plenty of publicly-available NGS data, some of it relevant to my current work and my organisation is predicting a move away from microarrays and towards NGS in 2012. So I figured: what better way to educate myself than to blog about it as I go along?

This is part 1 of a 4-part series and in this installment, we’ll look at how to get hold of public NGS data.
Read the rest…
Interacting with bioinformatics webservers using R

In an ideal world, all bioinformatics tools would be made available via the Web as a web service with an API, as well as a standalone package to download for local use. This is rarely the case and sometimes, even where one or the other is available, factors such as cost come into play. So we resort to web scraping; writing code to interact with the code that lies behind a web server so as to submit queries, retrieve and parse results.

Normally, I’d use something like Ruby’s Mechanize library for this purpose. However, where the purpose is to retrieve delimited data for analysis using R, I figured it was time to try and achieve the entire process within R. So here’s how I used the RCurl and XML packages to interact with the WHAT IF server, which provides tools for the analysis of protein structure.
Read the rest…

R: calculations involving months

Ask anyone how much time has elapsed since September last year and they’ll probably start counting on their fingers: “October, November…” and tell you “just over 9 months.”

So, when faced as I was today with a data frame (named dates) like this:

pmid1       year1    month1     pmid2      year2    month2
21355427    2010     Dec        21542215   2011     Mar
21323727    2011     Feb        21521365   2011     Jun
21297532    2011     Feb        21336080   2011     Mar
21291296    2011     Apr        21591868   2011     Jun
...

How to add a 7th column, with the number of months between “year1/month1” and “year2/month2”?
Read the rest…